So how do we fix the memory issue? First, we need something to measure. I will be using three values: first is the amount of memory that the GC from C# believes is in use, the second the amount of private memory C# thinks it uses and third is the amount of total memory windows task manager thinks the application is using. These values will be represented as A/B/C.
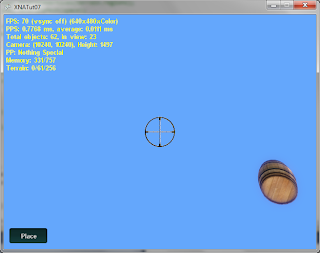
So first we start testing with an map where we only load up physics, without creating terrain geometry:
See? There is nothing visible, but a barrel is still rolling around. Even better, let's not load up even physics to get a memory consumption of 22/89/75. This is the baseline.
After loading physics we get 22/91/80. Physics data should take up at least 16 MiB, so clearly these memory consumption values are not too accurate. I'll ignore this fact for now.
But when creating visual debug information for physics, even when not visible, we get a whooping 326/1017/1247:
So debug physics information should not be created only on special executions of the program meant for debugging and even then only for a subset of the world.
So let's make some calculations: 60 * 16384 = 983040 (0.94 MiB). This is how much a chunk of world should eat up. Using 256 chunks we would get 240 MiB. That is too much and anyway the GPU can't render so many chunks at good speed. Rendering around 64 would give us a use of 60 MiB, so a total of around 140?
Well this is what I get for one single chunk: 308/766/552! Pretty bad. So for now I'll disable all vertex buffer creation and I'll send the data each frame to the GPU. I'm hopping that I'll replace this system with a smarter one that dynamically allocates and frees buffers on a need by need basis while keeping memory use under a certain threshold, but for now I'll just remove all vertex buffers and eat the framerate drop.
And we get 308/508/550. OK, time to go bugfixing. After a while for a single loaded chunk I get 70/249/237.
Then I do the same for index buffers and get the final values of 70/147/142 for one loaded chunk.
This seems like a good progress, but it is not. A day has passed, I'm loading up the game again and I am getting completely different values and they are larger! A lot larger!
Back to step zero for today. I start doing a far more thorough profiling and cleanup. The new baseline is 4/70/58 for nothing loaded. And I do mean nothing. I have no idea what is eating up all this RAM. After some investigation, the game seems to start at 19 MiB (Windows provided value) then it goes up to 26 after device initialization, then i goes up to 43 before starting to load the terrain. A lot, but fair enough. And finally once things are up and running, we get around 56 MiB use. So lets say that this is our new baseline: 4/64/56.
Now, I don't want o see a growth larger than 16 MiB now once I load up physics. That would make it somewhat consistent with yesterdays values and also makes sense. Alas, no such luck, we get today weird values of 70/130/124.
I start and do some ridiculously detailed memory profiling and also clean up all the code. After watching the memory allocator more intensely than watching a person you suspect is about to steal your friend chicken, I get back to 20/82/73. This is in line with yesterdays starting values and this time I am fairly sure that nothing gets allocated that is not needed.
This only for loading physics, not actually activating it. After activation the values remain roughly the same. So we are back to where we left of yesterday, only this time we have a more clean and controlled code doing the dirty work.
Now I need a pooling resource allocator that is 100% in charge of giving me fixed size memory chunks for my level geometry and also taking care of them when not needed. The implementation almost guarantees that the memory goes only up as you walk around, but never above the view distance. When less memory is needed when the max the "free" parts are not actually freed, just pooled for later use.
So using this allocator I got this result:
Finally, an improvement! After walking around for a few minutes the memory stabilized at around 119/95/321:
And with textures we get 142/95/590:
Now this is the first version only and there are still some improvements to be made until I can get the optimal values. I also tried to improve the view distance. Still needs some tweaks.
And add a skybox. And I failed miserably. I guess a few hours of memory work turn you into an idiot who can't implement a simple skybox.


No comments:
Post a Comment